


Population Demographics
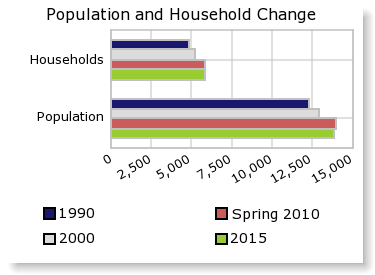
The number of households in the study area in 1990 was 4,862 and changed to 5,212 in 2000, representing a change of 7.2%. The household count in Spring 2010 was 5,791 and the household projection for 2015 is 5,802, a change of 0.2%.
The population in the study area in 1990 was 12,287 and in 2000 it was 12,871, roughly a 4.8% change. The population in Spring 2010 was 13,968 and the projection for 2015 is 13,886 representing a change of -0.6%.